Hidden Technical Debt of AI Systems: Agent Evaluation Infrastructure
Most conversations about evals collapse into which SaaS tool to buy, which metrics to track, which LLM-as-a-judge prompt to slap on, or which single headline benchmark score to worship. SWE-bench percentage. Humanity’s Last Exam. ARC-AGI. Pokémon Red. Or most often, a directive from the top saying LGTM. These scores are useful, but they are not the evaluation infrastructure. They are the artifacts left behind by a much larger system: task definitions, runtimes, snapshots, trace capture, state diffs, verifiers, judge calibration, replay, release gates, and production feedback.
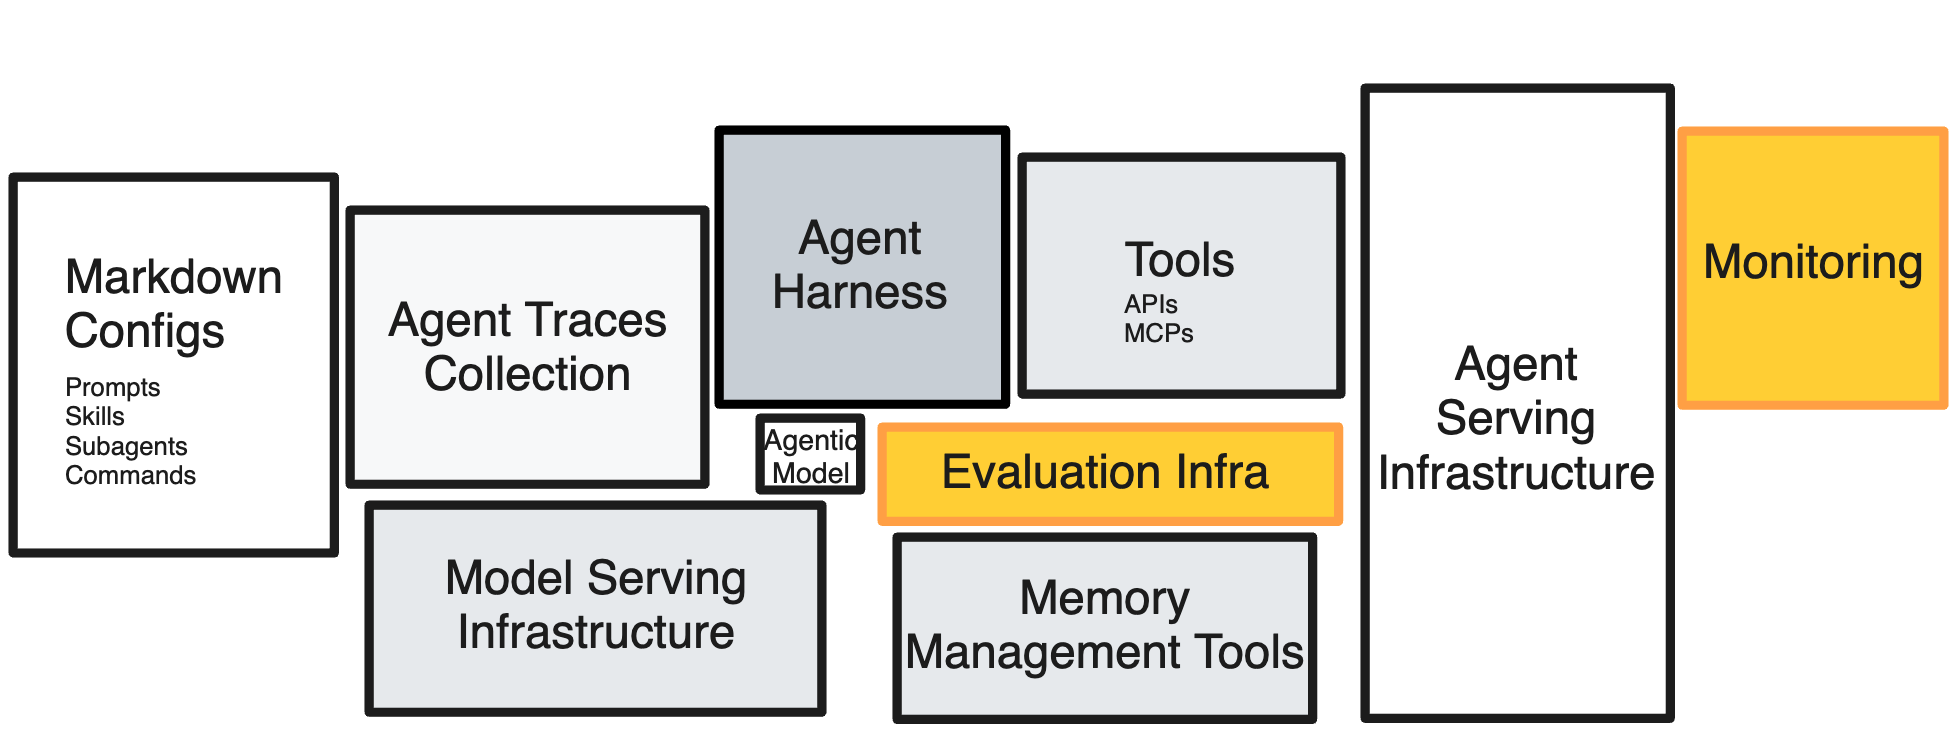
For agentic AI systems, evaluation infrastructure has to do two jobs: a control plane that decides what to run and whether the result should change what we ship, and a data plane that runs the agent and records what actually happened. The rest of this post is about building both, and why the data plane is the hard part.
This post is about evaluation infrastructure and monitoring: the underlying system for how we benchmark agents, develop models and systems in a scientific, experiment-driven manner, and monitor production services across post-training, applied AI development, and inference time. We will also touch on how to use this same system to continuously learn and update an agentic AI system.
This is the fourth post in the series. The first defined the RL environment as a five-tuple — tasks, harness, verifier, state, configuration; the second went down to the runtime and its sandbox primitives; the third covered the agent harness. Evaluation infrastructure sits across all of them, and it is the most durable layer — the one that persists across model updates, harness rewrites, and runtime refactors.
And it is not about how to “run a benchmark.”
Rollouts
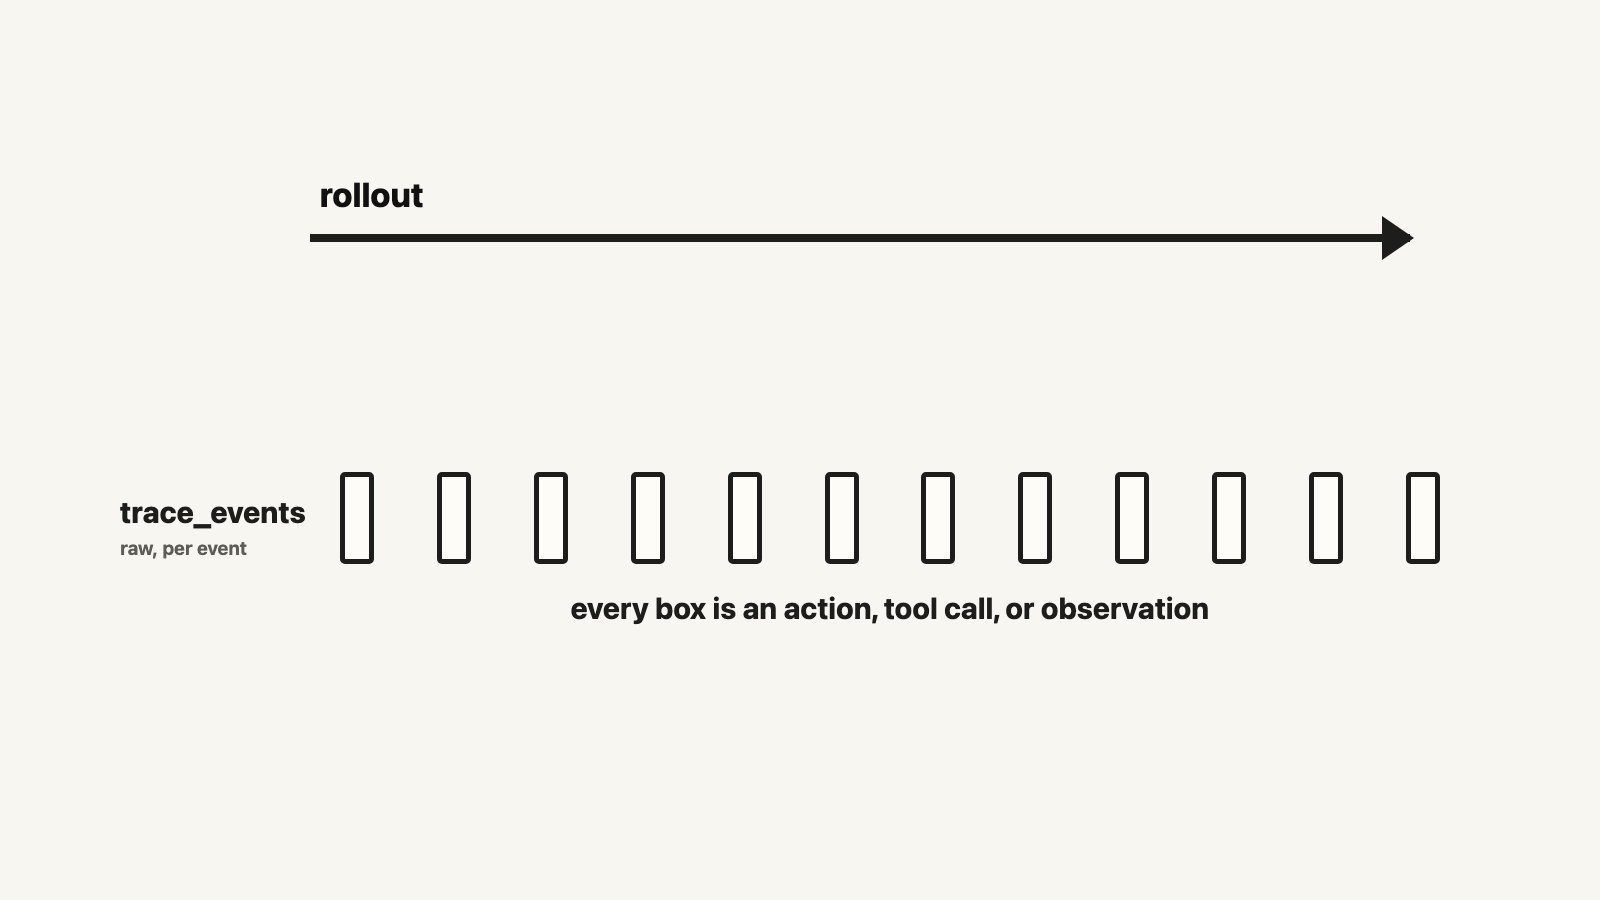
Rollouts is the core artifact of an Agentic AI system. Give an agent a task, the agent acts on an environment using tools, skills, sub-agents, memory, dynamic workflows, stopping criteria, and whatever heavy or thin harness wrapped around the model. The bounded attempt from initial state to terminal condition is an episode. Running the agent through that episode is a rollout. Or a trajectory using reinforcement learning abstractions: states, actions, observations, rewards. The recorded observability artifact is a trace: messages, tool calls, etc.
This is different from traditional machine learning, where we have inputs and a set of golden labels, tests, or holdouts. Data in, prediction out, and a score that measures how model output deviates from expected output. Heck, this is even different from the chat assistant evaluation we had in early years of ChatGPT, where an evaluation is a set of input prompts, the output responses, and some labeled data or some arbitrary metrics.
For agentic AI systems, we not only care about the final response or artifact, we also care about how it got there. The systems became multi-step with evaluation alongside with it.
The final response is only one artifact produced by the agent and not the full picture. As an example, a coding agent may end with a patch that passes tests, but the trace might show that it deleted tests it couldnt pass, removed files unrelated to the task, leaked a token into a log, or spent a few dozen tool calls looping on the same failing command. A research agent may end with a polished report, but the trace shows it laundered a claim through a circular citation. A calendar agent may say it scheduled the meeting, but the state delta has the wrong timezone or duplicate invite.
This is all to say that agents complete tasks by changing the environment, so final-output-only evals are no longer sufficient. This is the structural reason agent evaluation infrastructure looks less like a metric library and more like an experimental control plane sitting on top of a data plane.
The data plane is where the agent acts: the model, harness, runtime, tools, memory, environment state, traces, outputs, logs, snapshots, and state deltas. The control plane governs those runs: task selection, experiment and perturbation design, ablations, replay policy, verifier selection, score aggregation, regression tracking, dashboards, and release gates.
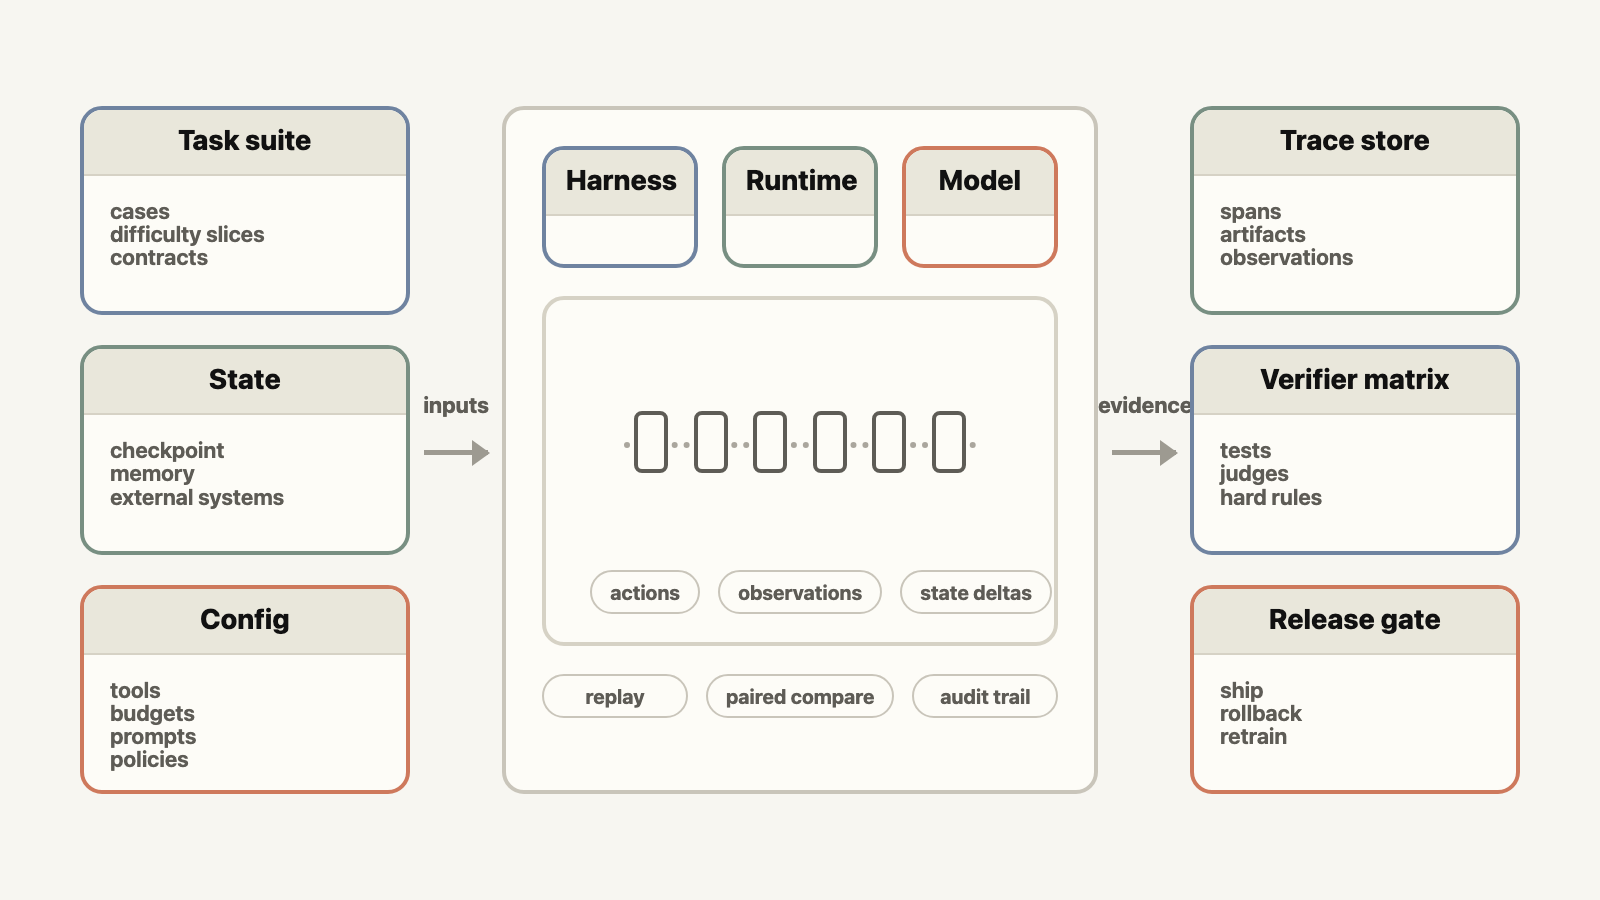
\[\underbrace{T, C, G}_{\text{control plane}} \;\rightarrow\; \underbrace{M, A, R, S, \tau}_{\text{data plane}} \;\rightarrow\; \text{traces, state deltas} \;\rightarrow\; \text{ship / rollback / retrain / acquire data}\]where:
- $T$ = task suites, task distributions, including verifiers, rubrics, judges, and human review
- $C$ = configuration, skills, tools, stopping rules, token budgets, etc, for benchmarking and experimentation.
- $G$ = reports, dashboards, regression tracking, and release gates
- $M$ = model
- $A$ = harness
- $R$ = runtime
- $S$ = initial state, checkpoints, memory, and state deltas
- $\tau$ = trace schema and trace store
The control plane turns each run into a normalized, auditable, replayable experiment record, and that record drives the decision: ship, rollback, retrain, change harness, fix runtime, curate more envs, or fixing data mixture. Scoring the final response is the easy part. The harder problem is building a data plane rich enough that the score is explainable, reproducible, and actionable.
Chat Eval Was a Spreadsheet. Agent Eval Is a System.
Evaluating a single-turn chat assistant is simple. You collect prompts, generate responses, and score each one against a reference answer, a preference model, or an LLM judge. One input, one output, one turn. The whole thing fits in a spreadsheet -— prompt, response, label, score -— and if the average goes up, the assistant got better. There is only conversation state which is already tracked as texts on the screen.
Agentic systems have units of work measured in an episodes that can run hundreds of steps or more. That’s quite more complex than simple prompt-and-response pair. The agent calls tools, reads files, writes to databases, spawns sub-agents, and edits its own memory. The failure mode can hide at any steps in the rollout, not just at the final response. Run the same task twice and you might get two different traces, because the agents are nondeterministic and the world moved underneath the agent. And the mistakes become bad actions like deleted file, unfaithful reasoning, leaked secret, deleted file, a wrong refund, a leaked secret.
Same task, but every axis of the evaluation got harder:
| Concern | Single-turn chat eval | Agentic system eval |
|---|---|---|
| Unit of work | Prompt and response | Episode and trajectory |
| Main artifact | Output text | Output, trace, state delta |
| Failure modes | The final answer | Any step in the rollout |
| Environment | Static prompt set | Mutable runtime, tools, and memory |
| Verification | Score the answer | Score outcome, process, and state |
| Reproducibility | Seed and prompt | Seed, state, runtime, tools, memory, clocks, APIs |
| Cost | Inference tokens | Inference, tools, runtime, and human review |
| Safety | A bad answer | A bad action |
A single aggregated score provides very sparse reward signal for us to udnerstand the agentic system. Thus we have to slice the full environments to understand and debug the agent. These includes task type, difficulty, tool family, runtime, memory state, safety class, cost bucket, latency bucket, and failure mode.
And the same infrastructure serve the entire agentic development lifecycle. Training and data work leverage the configurations for experimentation to decide what to curate and which environments to fold into the data mixture. Post-training utilizes this to monitor traces for alignment and safety. Applied development leans on it to hill-climb the eval score. A production gate leans on it to catch regressions and confirm expected behavior before release. And once the agent is live, the same instrumentation can also serve for production monitoring.
This is also why the same system shows up under two names. The first post in this series defined an RL environment as a five-tuple of tasks, harness, verifier, state, and configuration. From an eval teams perspective its a eval harness. The verifier that gates a release can often be reused as, or translated into, the reward signal that shapes a policy. That is why the evaluation layer outlives any single model or training run.
A spreadsheet and a simple script is no longer enough. Even at the end we report one single number.
Evaluation and monitoring surfaces
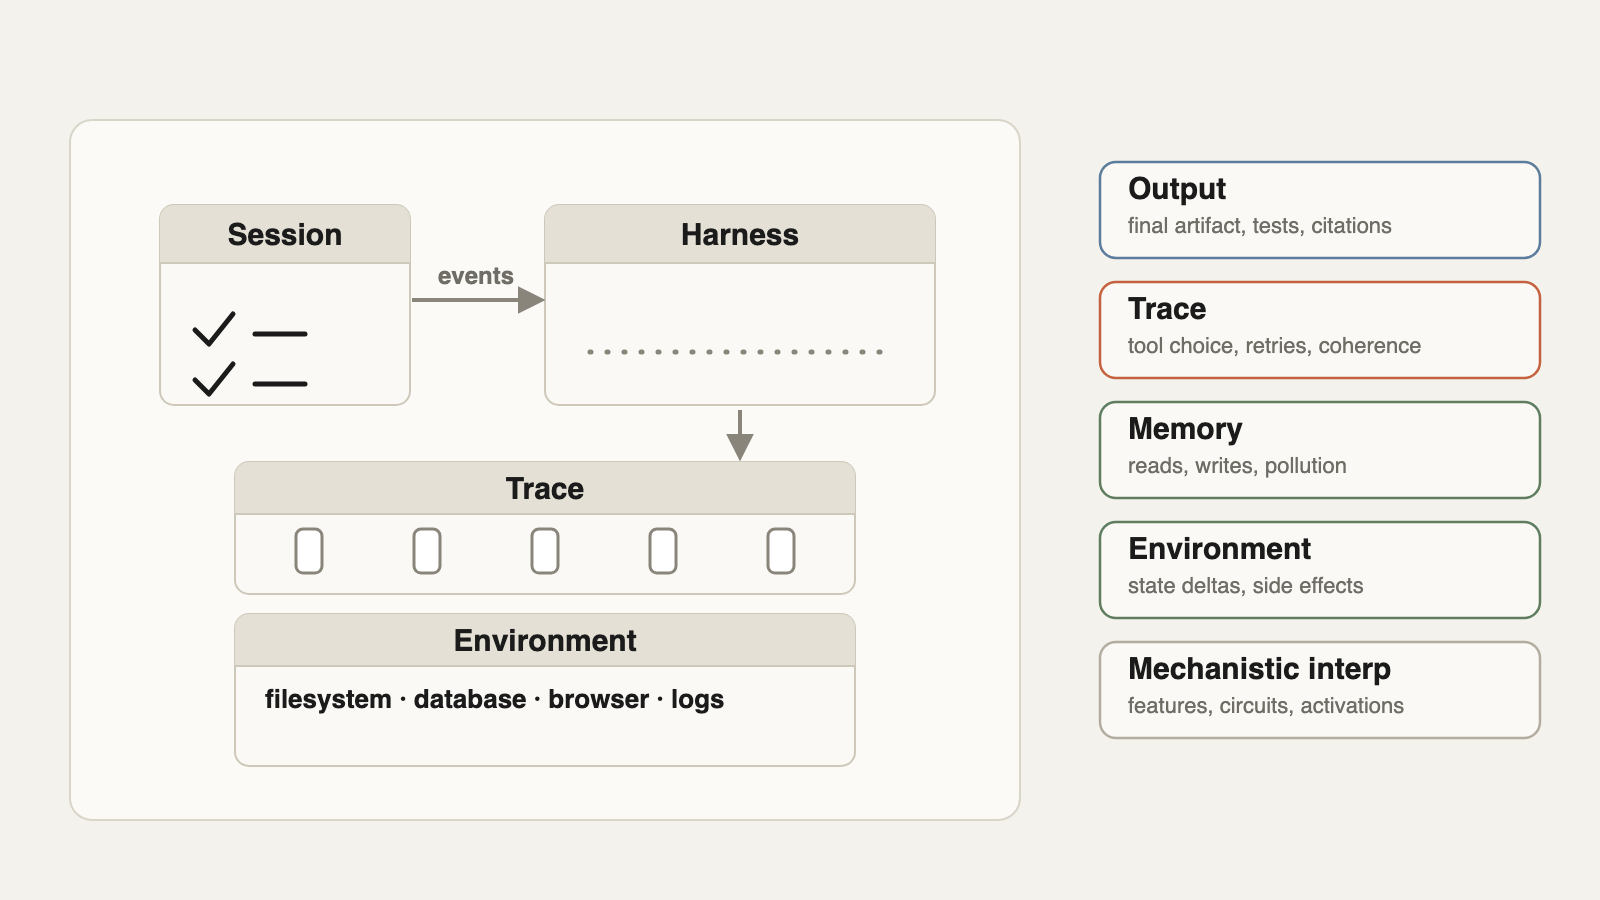
There are five surfaces for evaluating agent behaviors and requires different treatments – output, trace, memory, environment, and mechanistic interpretability. The first four are extrinsicly observable surfaces. Mechanistic interpretability is a subset of AI research on methods for inspecting model internals. This framing ensures you to look beyond just the final output.
1. Output
The final output is still the obvious first surface. Did the agent complete the task? Did the code pass tests? Did the spreadsheet reconcile? Did the answer cite sources that actually support the claim? Did the generated financial report validate against the source numbers? Did the UI meet the acceptance criteria?
Evaluation of these typically splits into verifiable tasks, such as math and coding, and open-ended tasks, such as analysis, research, and writing. The rewards/verifier can ouptut into a single score for convenience. To make them useful for research and experimentation, its usually breaking down into a matrix or a rubrics of scores to provide more signals for us to make decisions.
2. Trace
An agent might take a few steps or a few thousand. You can model the jumps between states as a state transition matrix, but over a ng run that is too manual to maintain and too coarse to be useful. Knowing how often the agent went from “search” to “read” to “write” tells you something, but not what the run looked like or whether the agent worked through the task sensibly.
Looking directly at the agent traces lets you ask process questions:
- Did the agent use the tools it was supposed to use?
- Did it use tools it should not have used?
- Did it retry a failing tool until the budget burned down?
- Did it inspect the right files before editing?
- Did it validate after making a change?
- Did it cite sources it opened?
- Did it follow prompt-injection instructions embedded in tool output?
- Did the tool use cohere with the stated reasoning, or did the agent say one thing and do another?
This is the surface the rest of the infrastructure has to capture, and capturing it is not the same as keeping a console log. A usable trace is a structured record of every step: the tool called, the arguments passed, the observation returned, the latency and cost, and the state delta the action produced. This is most often captured in OpenTelemetry-style spans. Without that structure the process questions above are unanswerable, and you are back to grading the final answer.
Traces should not be scored primarily on whether they follow one golden path. Golden paths are useful for protocol compliance, regression tests, and regulated workflows, but they are a weak measure of agent intelligence. The stronger target is process invariants metrics and questions like “no unsafe writes” or “no jumping straight to a conclusion.”
A polished final answer does not mean its faithful to the context. A tool call can be syntactically valid but semantically useless. A response can be high quality while the path that produced it is unsafe or excessive. These are different failures, and a serious eval cannot infer one from the others.
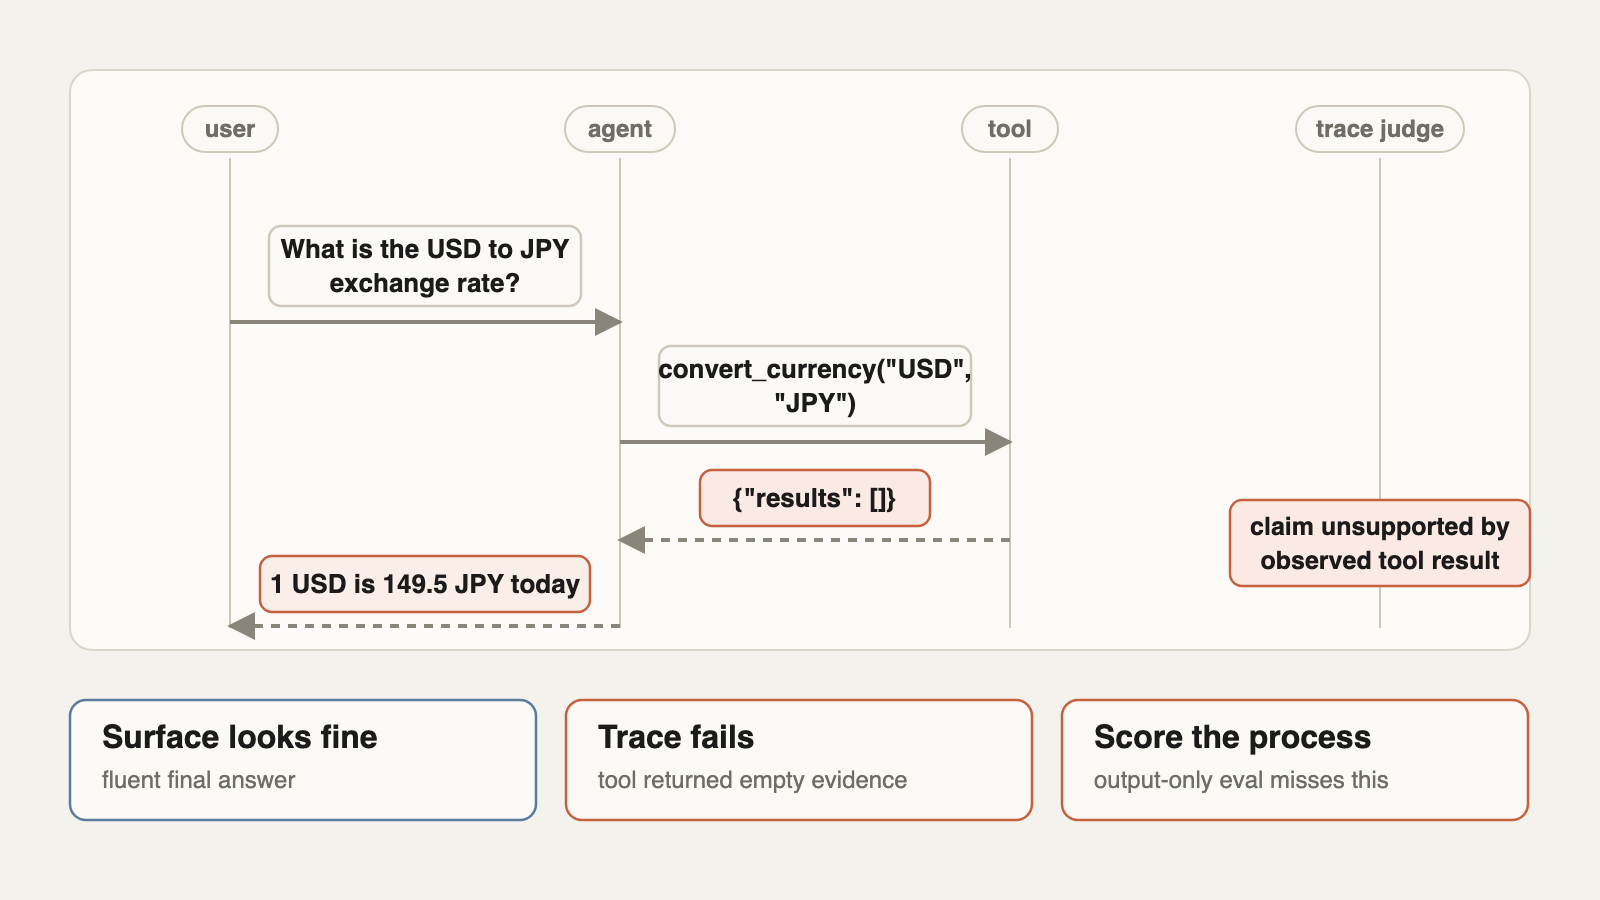
The canonical trace-level failure is the empty tool result hallucination. The user asks for a number. The agent calls the right-looking tool. The tool returns an empty list. The agent fabricates a plausible answer. To the user, the final answer looks fine. To a trace evaluator, the answer is unsupported by the only evidence the agent actually observed.
A minimal trace record should include: run id, task id, step index, model and harness version, prompt/config hash, tool name, arguments hash, observation hash, latency, cost, permission boundary, state delta pointer, checkpoint id, verifier result, and failure labels. Anything less becomes hard to replay, compare, or audit.
The trace is what lets you evaluate whether the agent retried, changed parameters, escalated uncertainty, or reward hacked.
3. Memory
Memory here is not one single thing. There is conversation context, scratchpads, progress files, AGENTS.md, CLAUDE.md, memory.md, soul.md, skills, project docs, retrieved snippets, vector-store entries, cached summaries, and any other state the agent can read or change dynamically after deployment.
That layer needs evaluation because memory pollution changes agent behavior silently.
An agent can record an unintentional user note into a memory file and pollute context into the future. It can summarize a task incorrectly and carry the error forward. It can overfit to one user’s preference and apply it globally. It can inject misaligned data into a skill. It can decide that a temporary workaround is permanent truth.
The analogy is the YouTube dark hole. A recommendation system watches one session, over-exploits the user’s revealed intent, and corners them into the same narrow distribution. Agent memory can do the same thing to work. One bad episode becomes a durable preference. A polluted memory narrows exploration, repeats mistakes, and makes the agent look more confident as it gets worse.
A serious eval system should eval and monitor memory reads and writes:
- What memory did the agent consult?
- What did it update?
- Was the update justified by the task or user preference?
- Did the memory change improve future rollouts or poison them?
- Can we replay the same task with memory disabled, stale memory, clean memory, and polluted memory?
If memory is part of the harness, it is part of the evaluation surface.
4. Environment
Many agent tasks are state-transition tasks, not conversational text generations.
The agent changes a repository, a database, a spreadsheet, a calendar, a ticket queue, a browser session, a filesystem, a feature flag, a log stream, or a deployment environment. The correct answer is both what the agent respond at the end AND the environment, state, and artifaacts changed in the right way.
So the unit the infrastructure has to capture is the state delta: files added or deleted, database rows updated, migrations applied, environment variables touched, logs emitted, git refs changed, secrets accessed, browser cookies persisted. That means snapshots and diffs at each step, not only at the end — a calendar agent that reports “scheduled the meeting” can still used the wrong timezone or created a duplicated invite. We can only find these out through state deltas.
Capturing state per step, rather than only at the terminal state, is also what makes failure attribution possible. Outcome-level eval tells you the task succeeded or failed; the sequence of state deltas tells you which step caused it. For long-horizon agents that is the difference between knowing the run failed and knowing where. How you then score a transition is a verifier question and the evaluation infra provides the data for it.
If your eval does not capture the state delta, it is not flexible enough to evaluate tasks that are stateful.
5. Mechanistic interpretability
Mechanistic interpretability is the field that tries to understand neural networks by inspecting internal computations: activations, circuits, features, causal pathways. Sparse autoencoders (SAE) take layer activations and learn interpretable latent features. Transcoders try to map internal transformations between layers. Cross-layer transcoders (CLT) push the idea further by looking at computational graphs and causal relationships across layers rather than treating one layer in isolation.
This is the brain-surgery way of evaluating and monitoring AI agents. However, these are not available to teams using proprietary APIs. If you are calling a frontier model through an endpoint, you do not get layer activations. You get outputs, tool calls, token usage, and maybe logprobs if the API exposes them. Mechanistic interpretability belongs in the toolbox of teams who has full stack control, not in the average product eval dashboard.
For most builders, the absence of this means your extrinsic trace and state instrumentation have to be comprehensive.
Experimentation, Not Benchmarking
A benchmark is a frozen environment. Everyone can run the same benchmark with the same setup and have reproducible results.
Evaluation infrastructure for agents should be designed to be experimentation-driven, because the thing you are evaluating is a coupled system: model, harness, tools, runtime, memory, task distribution, state, and configuration.
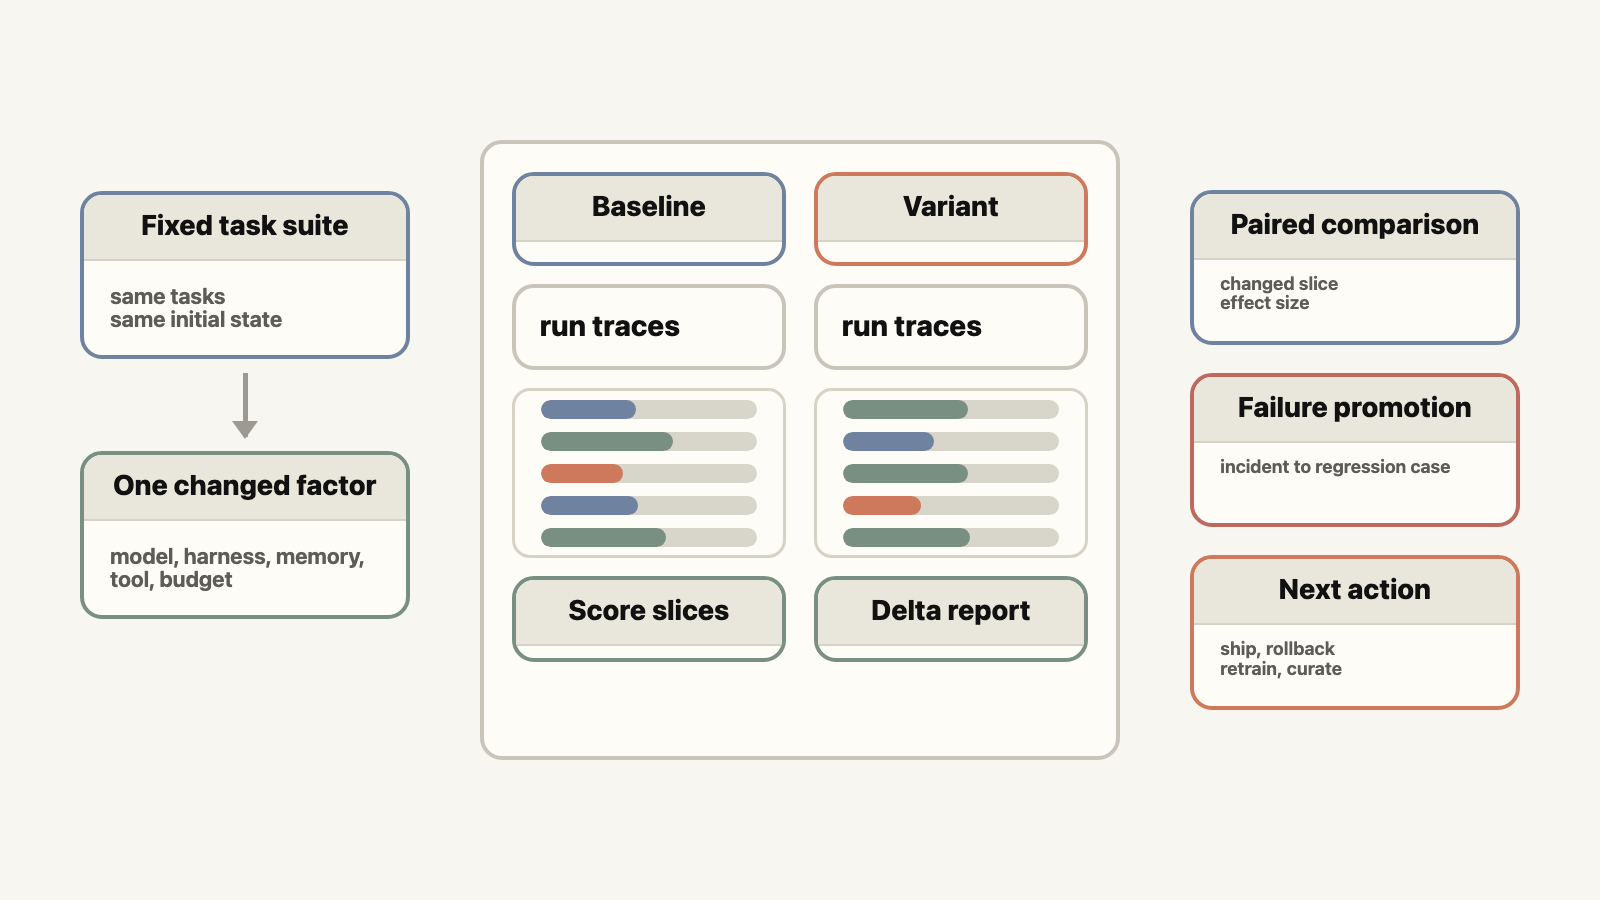
We should take the scientific method approach in doing evaluations. Treat every change as a hypothesis, i.e., a new model, a reworded prompt, an added tool, and treat each eval run as the controlled experiment that tests the hypothesis. Change one variable, hold the rest fixed, and decide whether the result is real. There are in general two types of experiment designs.
Perturbation tests hold the task fixed and vary the paths available to the agents, e.g., change the turn limit, modify skills.md, randomly fail a tool, add stale documentation that conflicts with the source code. Because the intended task is unchanged, a change in performance isolates a single thing — whether the agent learned the task or just memorized one golden path.
Ablation tests remove one component at a time from the system and measure the delta against the baseline., e.g., long-term memory, semantic search, browser access, sub-agents, agent skills. The delta from the ablation is then the component’s contribution, and it provides signals on where to invest. If removing memory barely moves the score, the memory layer is theater. If disabling the browser only hurts one slice of tasks, you have located exactly where the browser earns its keep.
The same perturbation discipline doubles as a guardrail test. Inject tool errors, increase response latency, revoke a permission, or shut a tool down mid-run, and watch whether the agent recovers or fails closed. An agent that only works when every tool is healthy is not robust.
Configuration is the experimental design, and good evaluation infrastructure keeps it modular so you can vary one factor without disturbing the others.
Decouple the task from the harness. What you measure are in the control plane (the dataset, the answer contract, the scorer), separate from how you run it in the data plane (the model, the tools, the harness, the sandbox). Otherwise a model change and a harness change land in the same number and you cannot tell which one moved it — the confound that ruins the experiment. Ai2’s olmo-eval makes this the central abstraction: the same task runs as a plain baseline or with tools and scaffolding without changing what it measures, so you can swap the runtime under a fixed benchmark instead of forking the benchmark every time the harness changes. It also keeps a lightweight path by default and only reaches for an isolated container when a task actually needs to run code the model wrote.
Treat the comparison as a measurement, not a readout. A 2.4-point move in an average can be a real improvement or pure noise; Simpson’s paradox applies, and the mean alone will not tell you which. Pair the runs and report the uncertainty with a confidence interval and a minimum detectable effect alongside every number, so we can discount a “gain” that sits inside the noise band. The useful question is not “did the number go up”; it is “which component did we change that caused which tasks flipped and in which direction.” All of these runs, including state, configs, should be stored so we can re-run the experiment months after for the same results.
The production version of this loop is incident capture. Sample traces, redact sensitive data, label failures, attach state deltas, and promote representative failures into the regression suite. Production monitoring should not live in a separate universe from offline evals; it should continuously update the task distribution that gates future releases.
Checkpoints, Branches, And Replay
Long-horizon agent evals need checkpointing for the same reason RL and game engines need state snapshots – re-running from the beginning is too expensive and hides the source of variance.
A checkpoint is a restorable snapshot of the environment plus enough execution metadata to continue or inspect the rollout. A filesystem snapshot alone is not enough. You also need the conversation state, retrieved memories, tool observations, model and harness version, random seeds if available, clocks, package versions, database state, network fixtures, and pending jobs.
Resume, replay, and branch are different.
Resume means continue the same attempt from a checkpoint under the same intended configuration. Replay means inspect or re-execute a known trajectory from a known state. Branch means start from the same checkpoint but change one factor: model, harness, memory, tool availability, budget, or verifier.
From one checkpoint, you should be able to branch alternate futures:
| Branch | Question |
|---|---|
| Same state, new model | Did the model upgrade help or regress? |
| Same model, new harness | Did the harness change matter? |
| Same task, memory disabled | Is memory helping or poisoning? |
| Same state, tool outage | Does the agent recover gracefully? |
| Same failure, replayed trace | Was the failure deterministic? |
| Same task, lower turn budget | Are we paying for unnecessary actions? |
This is the practical version of experience replay for agent systems. In RL, experience replay often means sampling stored transitions from a replay buffer during training. For evaluation and debugging, the idea is that we should be capturing experiences as reuseable data through trajectory replay or stateful replay.
The moment an agent mutates external state, checkpointing becomes a necessity to debug and experiment.
State Infrastructure Is Evaluation Infrastructure
In productivity tasks, agents live in filesystems and databases. They edit repos. They run migrations. They write documents. They update calendars. They change tickets. They leave logs behind.
That means evaluation infrastructure needs state infrastructure $S$.
For filesystems, you need git worktrees, copy-on-write directories, overlay filesystems, container layers, or VM snapshots. For databases, you need transaction snapshots, logical dumps, branchable databases, copy-on-write volumes, seeded fixtures, or per-branch schemas. For browser agents, you need profiles, cookies, local storage, network recordings, and DOM snapshots. For enterprise agents, you need branchable mock systems with access controls and side effects.
Experimentation branching must not share mutable state unless sharing is explicitly designed as part of the environmnet.
We can not ensure the integrity of our evals if they runs against the same database for an confounding compoenent. And an eval infrastructure that cannot restore the state to a checkpoint is logs, not eval infra. State is the part of evaluation infrastructure that traditional ML teams tend to underestimate. They are used to datasets. Agents need worlds. Agentic evaluation infra needs multiverses.
Evaluation Debt and Durable Infrastructure
Evaluation debt accumulates through convenience. Someone wrote a notebook, with a csv file for tasks set and judge prompts in a shared Excel file somewhere. The model is whatever the default API of the week behind some model router/gateway with an ever changing tools schema. The production runtime is “basically the same” as the eval runtime, failures are pasted into Slack as screenshots, and the dashboard shows a green line that nobody can trace back to the run that produced it. Everything runs, but together they make the evaluation unreproducible.
The bill comes due at the next model upgrade or customer complaints. The aggregate score improves and the dashboard stays green, yet customers report that the agent got worse, and the team cannot reproduce the regression because production ran with a different memory state, tool timeout, browser profile, and system prompt than the eval ever saw. Someone adds a few tasks to the golden set, the average ticks back up, and the real failure ships anyway. This is cargo cult evaluation - the number moved up and to the right because the measurement changed, not because the agent improved.
A durable evaluation layer is the system that resolves this with evidence rather than a manual dashboard inspection. It can identify which slice regressed and which trace pattern changed, attribute the cause to the model, harness, runtime, memory, verifier, or state, and distinguish the agent failing the task from the scorer failing the agent. It can replay the failure, promote it into the regression suite, and tie the outcome to a ship, rollback, retrain, or environment-fix decision.
Agents do not only need datasets. Agents need worlds. Evaluation infrastructure is how those worlds become measurable.
References
- Sculley, D., Holt, G., Golovin, D., Davydov, E., Phillips, T., Ebner, D., Chaudhary, V., Young, M., Crespo, J.-F., & Dennison, D. (2015). Hidden Technical Debt in Machine Learning Systems. NeurIPS. https://papers.nips.cc/paper_files/paper/2015/hash/86df7dcfd896fcaf2674f757a2463eba-Abstract.html
- Lee, H. (2026). A Taxonomy of RL Environments for LLM Agents. Han, Not Solo. https://leehanchung.github.io/blogs/2026/03/21/rl-environments-for-llm-agents/
- Lee, H. (2026). Hidden Technical Debt of AI Systems: Agent Runtime. Han, Not Solo. https://leehanchung.github.io/blogs/2026/04/24/hidden-technical-debt-agent-runtime/
- Lee, H. (2026). Hidden Technical Debt of AI Systems: Agent Harness. Han, Not Solo. https://leehanchung.github.io/blogs/2026/05/08/hidden-technical-debt-agent-harness/
- Allen Institute for AI. (2026). olmo-eval: An evaluation workbench for the model development loop. https://allenai.org/blog
- Sutton, R. S., & Barto, A. G. (2018). Reinforcement learning: An introduction (2nd ed.). MIT Press. http://www.incompleteideas.net/book/the-book-2nd.html
@article{
    leehanchung,
    author = {Lee, Hanchung},
    title = {Hidden Technical Debt of AI Systems: Agent Evaluation Infrastructure},
    year = {2026},
    month = {06},
    day = {13},
    howpublished = {\url{https://leehanchung.github.io}},
    url = {https://leehanchung.github.io/blogs/2026/06/13/hidden-technical-debt-agent-evaluation-infra/}
}